Pipeline State
The Pipeline Viewer is an information dense but simple window in RenderDoc. It shows all of the stateful settings of the graphics pipeline, including bound resources, rasterizer settings, etc.
Pipeline flowchart
At the top of the Pipeline Viewer is the pipeline flowchart - this shows the high-level block level diagram of the graphics pipeline.
Each block is a separate page which contains the relevant state and contents for that piece of the graphics pipeline, with specific details varying by API and the type of data to be displayed.
The currently selected block is outlined with red, and the page in view reflects the contents of that section of the pipeline. Light gray parts of the pipeline are those which are currently active and participating in this action. Dark gray parts of the pipeline are not enabled and can be considered pass-through/do-nothing.

Pipeline: Pictured here, the high-level parts of the Vulkan Pipeline.
Note
In D3D11 and OpenGL, the Stream-Out / Transform Feedback stage is available under the Geometry Shader block, with the buffers being used for stream-out shown.
Pipeline Section Display
The pipeline state viewer always displays the state of the pipeline after the execution of the action, as with the other viewers in RenderDoc.
Any resources that are bound to the pipeline can be opened in more detailed viewers, such as vertex buffers, constant buffers and textures. More details of this process can be found in the page How do I view details of an object?.
The pipeline view attempts to only show what is relevant, and not all possible stateful data. To do this (when available) it uses shader reflection data to only display slots which are actually in use by the shaders, and omit any that are unused. This can be overridden with the Show Unused Items  button.
On some APIs like Vulkan it may be common to use ‘bindless’ approaches where a large number of resources are bound and only a small number are accessed at any time. In these cases RenderDoc uses dynamic feedback to try to determine the set of resources accessed and only displays them. This can similarly be overridden with the Show Unused Items button.
When showing disabled/unused bindings, they will be listed in italics.
In some cases whole sections will be omitted unless there is anything set there - this is primarily for unused or rarely used features like shader subroutines/class linkage, and Read/Write bindings (Image load store or UAVs).
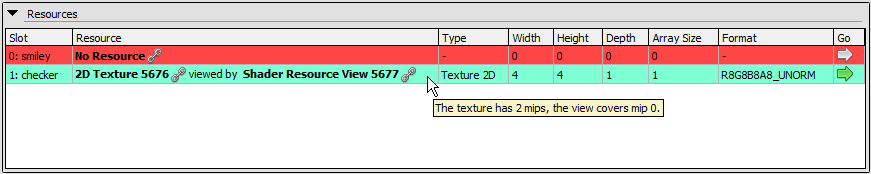
Pipeline: Pictured here, texture bindings in a D3D11 pixel shader.
When a binding is empty, it will be displayed with a red background. By default as above only bindings that could be referenced by the shader are displayed, so empty bindings indicate that the shader may be reading from an unbound resource. With the Show Unused Items button above, unused but empty bindings are still omitted for readability. To override this you can use the Show Empty Items  button which will show empty bindings.
If a binding is listed with a blue/green background this indicates that the binding has special parameters over and above the underlying resource. This could be for example an image with many mips or slices where not all of them are bound to the pipeline in the image view, or the view casts the image to a different compatible format.
Note
On OpenGL, incomplete textures will also be displayed with a red background. An explanation of why they are incomplete will be included in the tooltip when hovering over the entry.

Pipeline: The above pipeline section, collapsed to save space.
Sections can be expanded and collapsed by clicking on the title text above them to toggle them in and out of the collapsed state. This can be used to temporarily close down some sections that you don’t need to make room for more vertical space in sections you do need.
You can also export the pipeline state by clicking on the  export button, this will export the entire pipeline state in detail to an HTML file, so you can more easily compare between different logs and different events.